barh() — 수평 막대 그래프
카테고리 이름이 길거나, 항목이 많을 때 수평 막대 그래프가 읽기 편합니다.
import matplotlib.pyplot as pltimport matplotlibimport platformmatplotlib.rcParams['font.family'] = {'Windows': 'Malgun Gothic', 'Darwin': 'AppleGothic'}.get(platform.system(), 'NanumGothic')matplotlib.rcParams['axes.unicode_minus'] = Falseproducts = ['프리미엄 노트북', '무선 이어폰', '스마트 워치', '태블릿 PC', '게이밍 마우스']sales = [1250, 980, 870, 760, 640]# 값이 큰 순서대로 정렬sorted_idx = sorted(range(len(sales)), key=lambda i: sales[i])products = [products[i] for i in sorted_idx]sales = [sales[i] for i in sorted_idx]fig, ax = plt.subplots(figsize=(9, 5))ax.barh(products, sales, color='teal', height=0.6)ax.set_title('제품별 판매량 Top 5', fontsize=14)ax.set_xlabel('판매량 (개)')ax.grid(True, axis='x', linestyle='--', alpha=0.4)# 오른쪽에 값 표시for i, v in enumerate(sales): ax.text(v + 10, i, f'{v:,}', va='center', fontsize=10)plt.tight_layout()plt.show()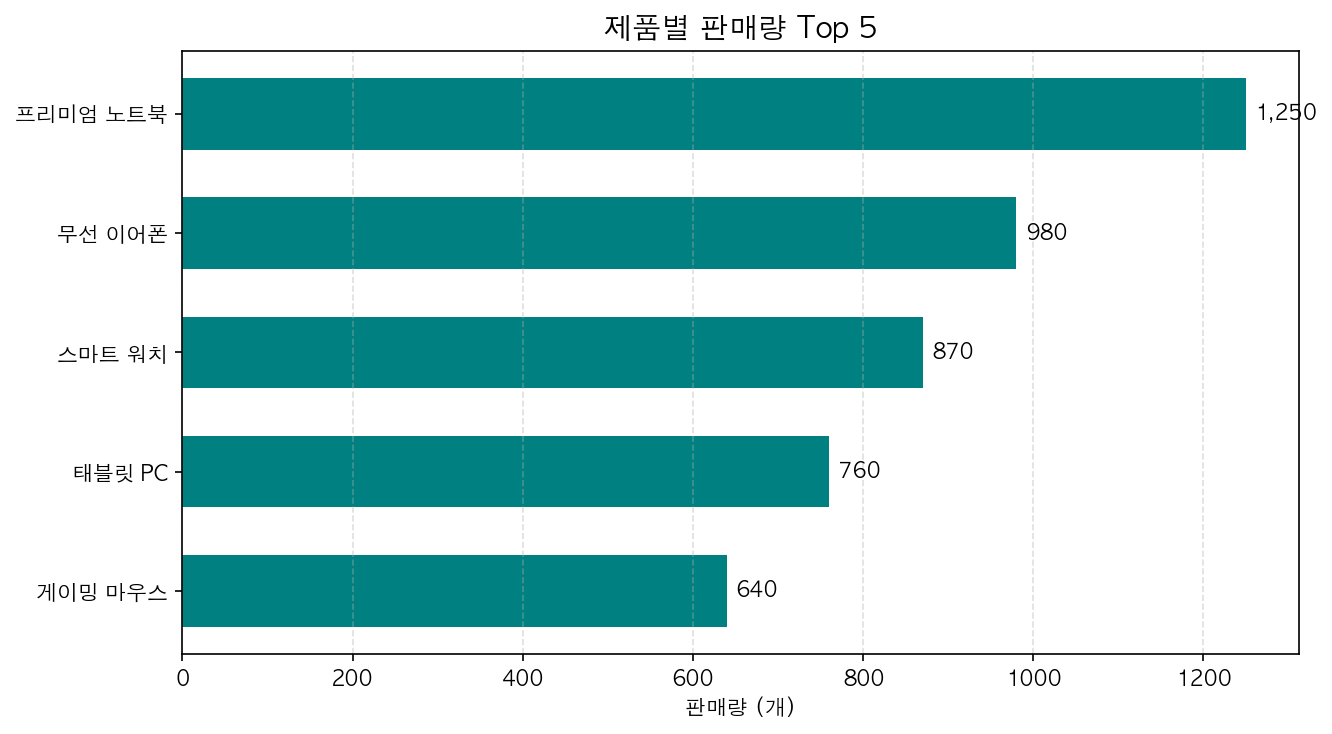
수평 막대 그래프는 긴 카테고리명을 x축 회전 없이 표시할 수 있다는 것이 가장 큰 장점입니다.