여러 선 그리기
ax.plot()을 여러 번 호출하면 같은 Axes에 여러 선이 그려집니다.
import matplotlib.pyplot as pltimport matplotlibimport platformmatplotlib.rcParams['font.family'] = {'Windows': 'Malgun Gothic', 'Darwin': 'AppleGothic'}.get(platform.system(), 'NanumGothic')matplotlib.rcParams['axes.unicode_minus'] = Falsemonths = ['1월', '2월', '3월', '4월', '5월', '6월']seoul = [1200, 1450, 1300, 1600, 1750, 1900]busan = [900, 980, 1050, 1100, 1200, 1300]jeju = [600, 700, 850, 1100, 1400, 1600]fig, ax = plt.subplots(figsize=(10, 5))ax.plot(months, seoul, label='서울', linewidth=2, marker='o')ax.plot(months, busan, label='부산', linewidth=2, marker='s')ax.plot(months, jeju, label='제주', linewidth=2, marker='^')ax.set_title('지역별 월별 방문자 수', fontsize=15)ax.set_xlabel('월')ax.set_ylabel('방문자 수 (명)')ax.legend()ax.grid(True, axis='y', linestyle='--', alpha=0.4)plt.tight_layout()plt.show()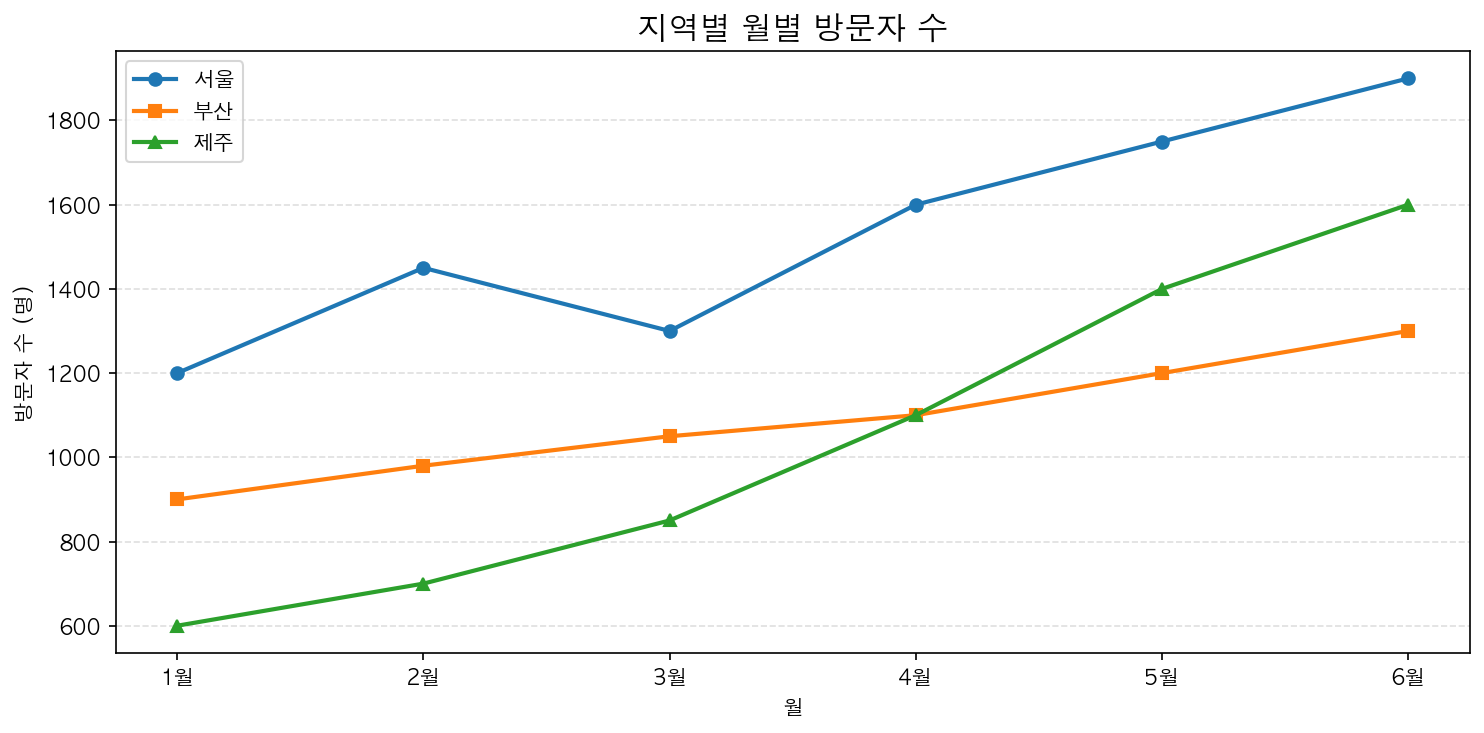
자동 색상 순환
label만 지정하고 color를 생략하면 Matplotlib이 자동으로 색상을 순환 배정합니다. 기본 색상 순환은 10가지 색상으로 구성됩니다.
색상 팔레트 변경
# 색상 순환 순서 변경plt.rcParams['axes.prop_cycle'] = plt.cycler( color=['#2196F3', '#FF5722', '#4CAF50', '#9C27B0'])