"그래프마다 색상 코드를 일일이 넣는 건 너무 비효율적이지 않나요?"
지윤의 질문에 팀장은 스타일시트를 소개했다.
내장 스타일 목록 확인
import matplotlib.pyplot as pltprint(plt.style.available)자주 쓰는 스타일.
| 스타일 | 특징 |
|---|---|
'seaborn-v0_8' |
부드러운 배경, 통계 분석용 |
'ggplot' |
R의 ggplot2 스타일, 회색 배경 |
'fivethirtyeight' |
저널리즘 스타일 |
'bmh' |
베이지 배경 |
'dark_background' |
다크 모드 |
'classic' |
Matplotlib 기본 클래식 스타일 |
스타일 적용
plt.style.use('seaborn-v0_8')fig, ax = plt.subplots(figsize=(8, 5))ax.plot([1, 2, 3, 4], [4, 3, 8, 5], label='데이터 A')ax.plot([1, 2, 3, 4], [2, 6, 4, 7], label='데이터 B')ax.set_title('seaborn 스타일 적용')ax.legend()plt.show()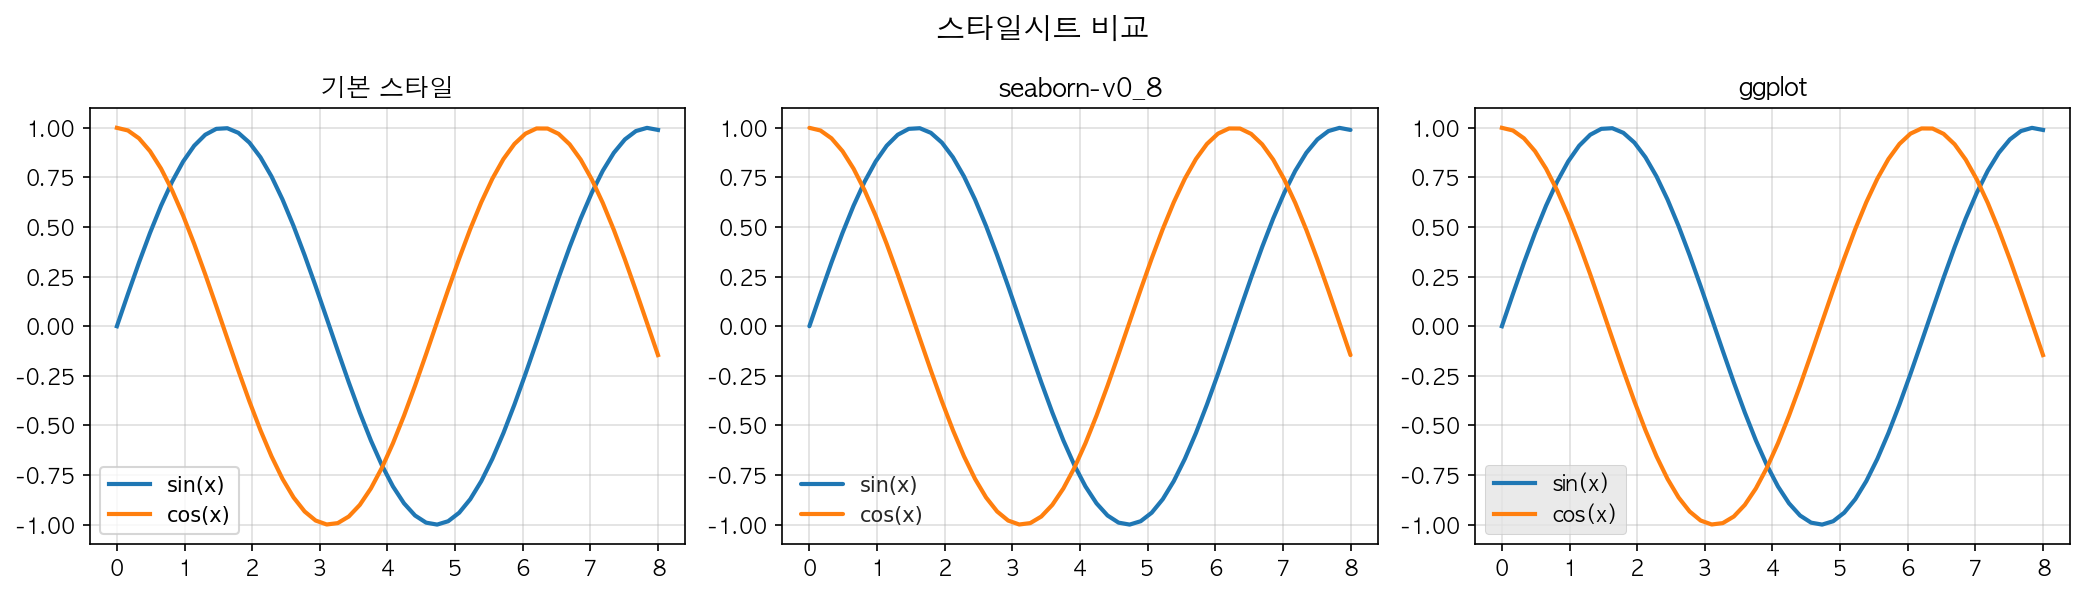
일시적 적용 (context manager)
with plt.style.context('ggplot'): plt.plot([1, 2, 3], [4, 5, 6]) plt.show()# 블록을 벗어나면 원래 스타일로 복원