GridSpec — 자유로운 레이아웃
subplots()는 격자형 배치에 제한됩니다. 크기가 다른 차트를 배치하려면 GridSpec을 사용합니다.
import matplotlib.pyplot as pltimport matplotlib.gridspec as gridspecimport numpy as npimport matplotlibimport platformmatplotlib.rcParams['font.family'] = {'Windows': 'Malgun Gothic', 'Darwin': 'AppleGothic'}.get(platform.system(), 'NanumGothic')matplotlib.rcParams['axes.unicode_minus'] = Falsefig = plt.figure(figsize=(12, 8))gs = gridspec.GridSpec(2, 3, figure=fig)# 왼쪽에 큰 차트 (2행 × 2열 차지)ax_main = fig.add_subplot(gs[:, :2])# 오른쪽 위ax_top = fig.add_subplot(gs[0, 2])# 오른쪽 아래ax_bot = fig.add_subplot(gs[1, 2])x = np.linspace(0, 10, 100)ax_main.plot(x, np.sin(x), color='steelblue', linewidth=2)ax_main.set_title('메인 차트 (넓은 영역)', fontsize=13)ax_top.bar(['A', 'B', 'C'], [3, 7, 5], color='coral')ax_top.set_title('보조 차트 1')ax_bot.pie([40, 35, 25], labels=['X', 'Y', 'Z'], autopct='%1.0f%%')ax_bot.set_title('보조 차트 2')plt.suptitle('GridSpec 레이아웃 예시', fontsize=15)plt.tight_layout()plt.show()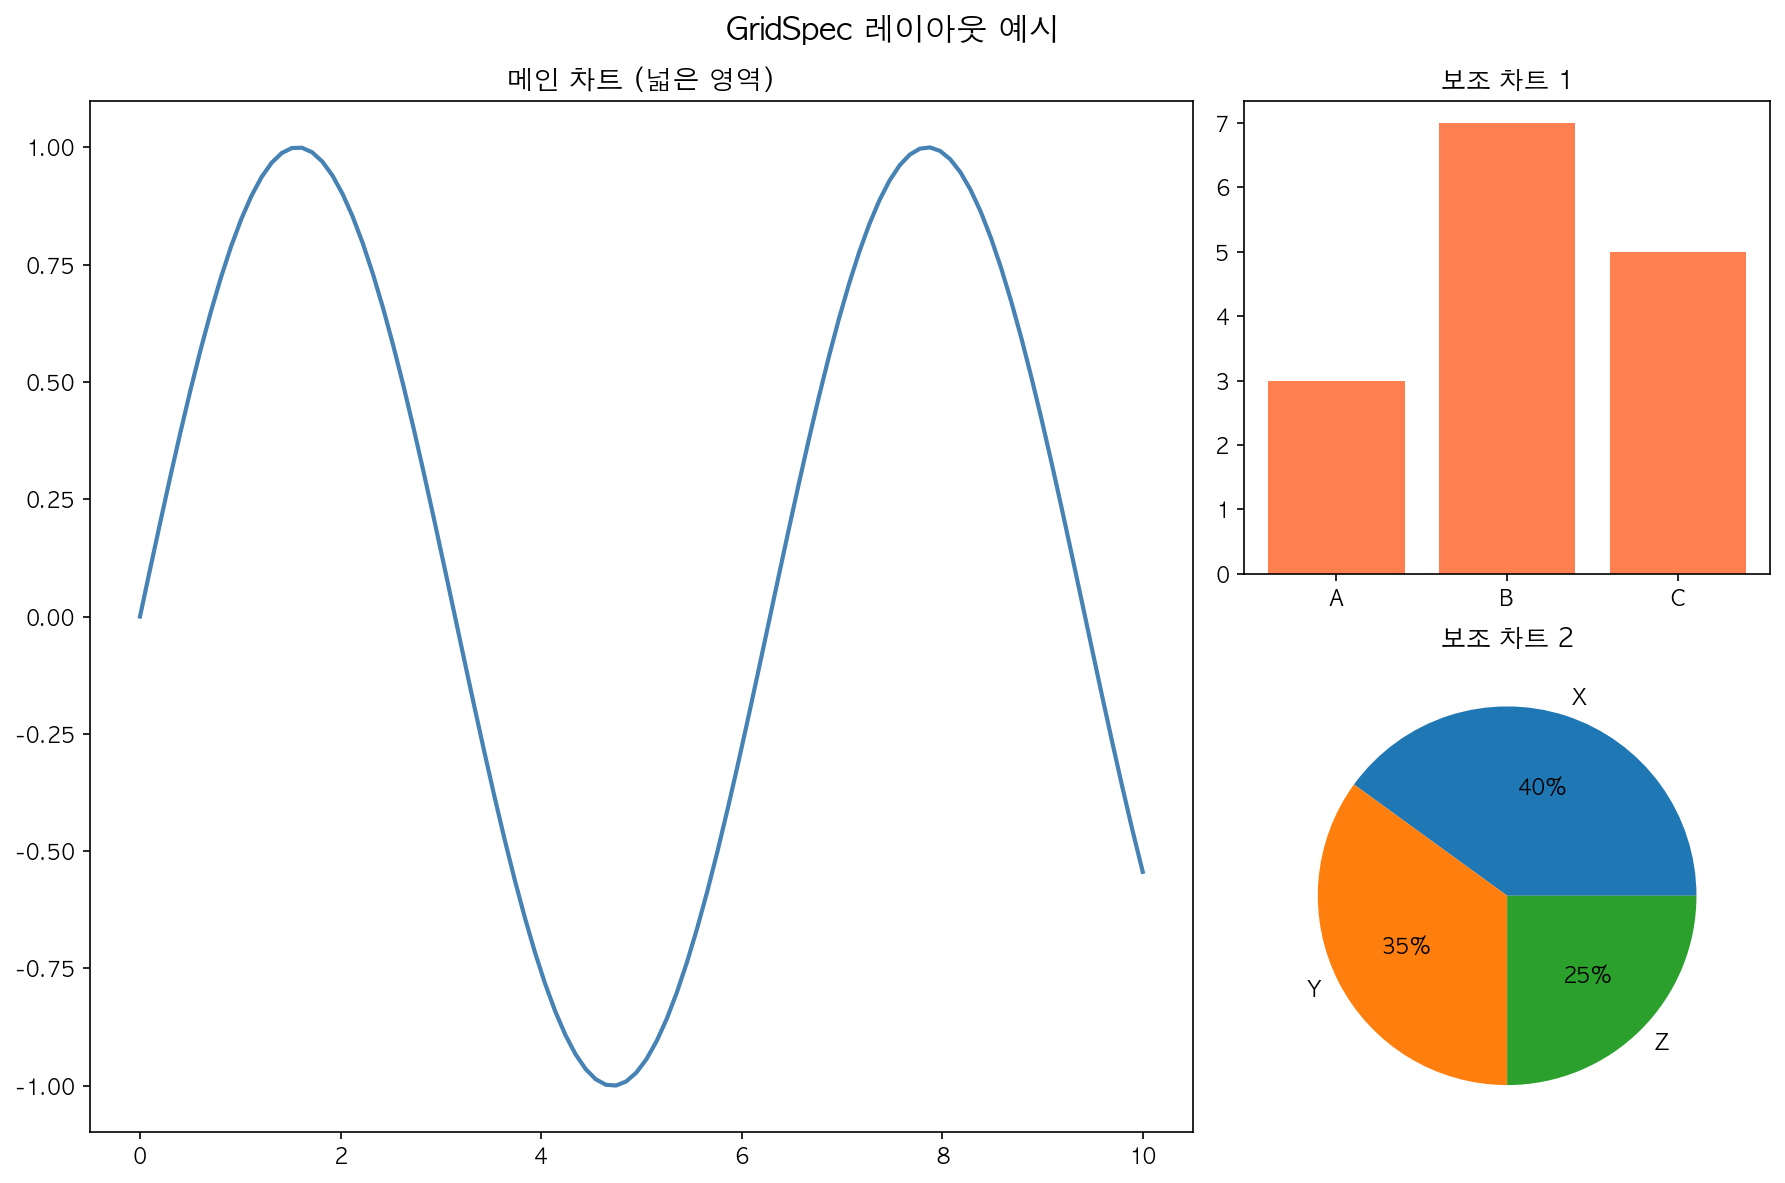
gs[행_슬라이스, 열_슬라이스]로 격자 셀을 병합해 사용합니다.
| 표현 | 의미 |
|---|---|
gs[0, 0] |
0행 0열 1개 셀 |
gs[:, :2] |
전체 행, 0~1열 |
gs[0, 2] |
0행 2열 |
gs[1:, 1] |
1행 이후 1열 |