df.plot()이 반환하는 것
df.plot()은 Axes 객체를 반환합니다. 이 객체를 변수에 받아서 Matplotlib 메서드로 추가 편집할 수 있습니다.
import pandas as pdimport matplotlib.pyplot as pltimport matplotlibimport platformmatplotlib.rcParams['font.family'] = {'Windows': 'Malgun Gothic', 'Darwin': 'AppleGothic'}.get(platform.system(), 'NanumGothic')matplotlib.rcParams['axes.unicode_minus'] = Falsedf = pd.DataFrame({ '서울': [120, 145, 130, 160, 175, 190], '부산': [100, 110, 125, 140, 155, 168],}, index=['1월', '2월', '3월', '4월', '5월', '6월'])# ax 객체를 받아서 추가 편집ax = df.plot(figsize=(10, 5), marker='o', linewidth=2)# Matplotlib 메서드로 추가 편집ax.set_title('지점별 방문자 수 비교', fontsize=15, fontweight='bold')ax.set_xlabel('월', fontsize=12)ax.set_ylabel('방문자 수 (명)', fontsize=12)ax.legend(loc='upper left')ax.grid(True, axis='y', linestyle='--', alpha=0.4)# 특정 달 강조ax.axvline(x='3월', color='red', linestyle=':', alpha=0.6, label='3월')plt.tight_layout()plt.show()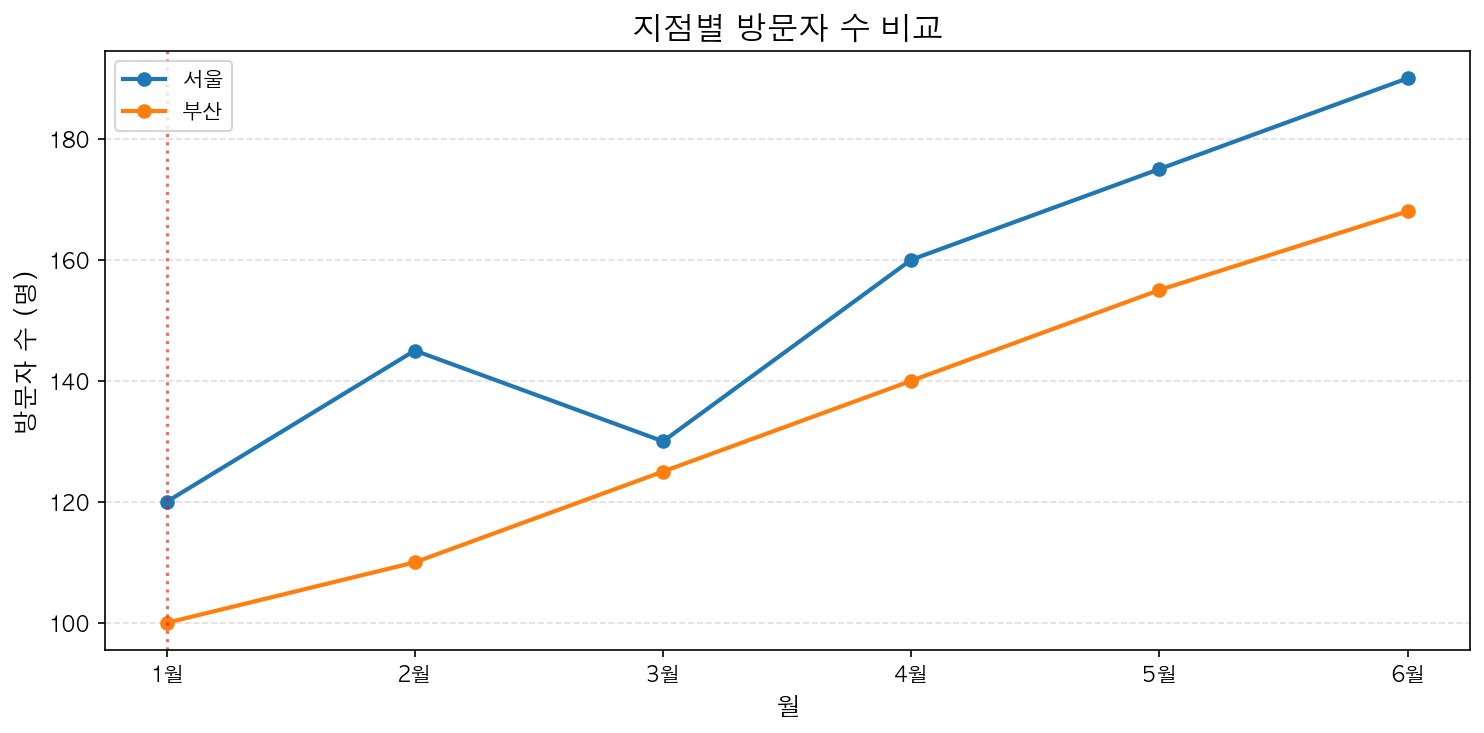
여러 DataFrame을 같은 Axes에
fig, ax = plt.subplots(figsize=(10, 5))df_a.plot(ax=ax, color='steelblue', label='2025년')df_b.plot(ax=ax, color='coral', linestyle='--', label='2026년')ax.set_title('연도별 비교')ax.legend()plt.show()ax=ax 파라미터로 기존 Axes에 그립니다. 이것이 Pandas와 Matplotlib을 결합하는 핵심 패턴입니다.